
Where Teams Unlock Their True Potential with Automation
Dive into featured projects that showcase how businesses turned everyday challenges into powerful opportunities for growth, efficiency, and innovation.
Find the Projects That Matter to You
Filter by industry, solution type, impact, company size, or use case to quickly discover the featured projects and case studies that bestalign with your business goals and challenges.
.webp)
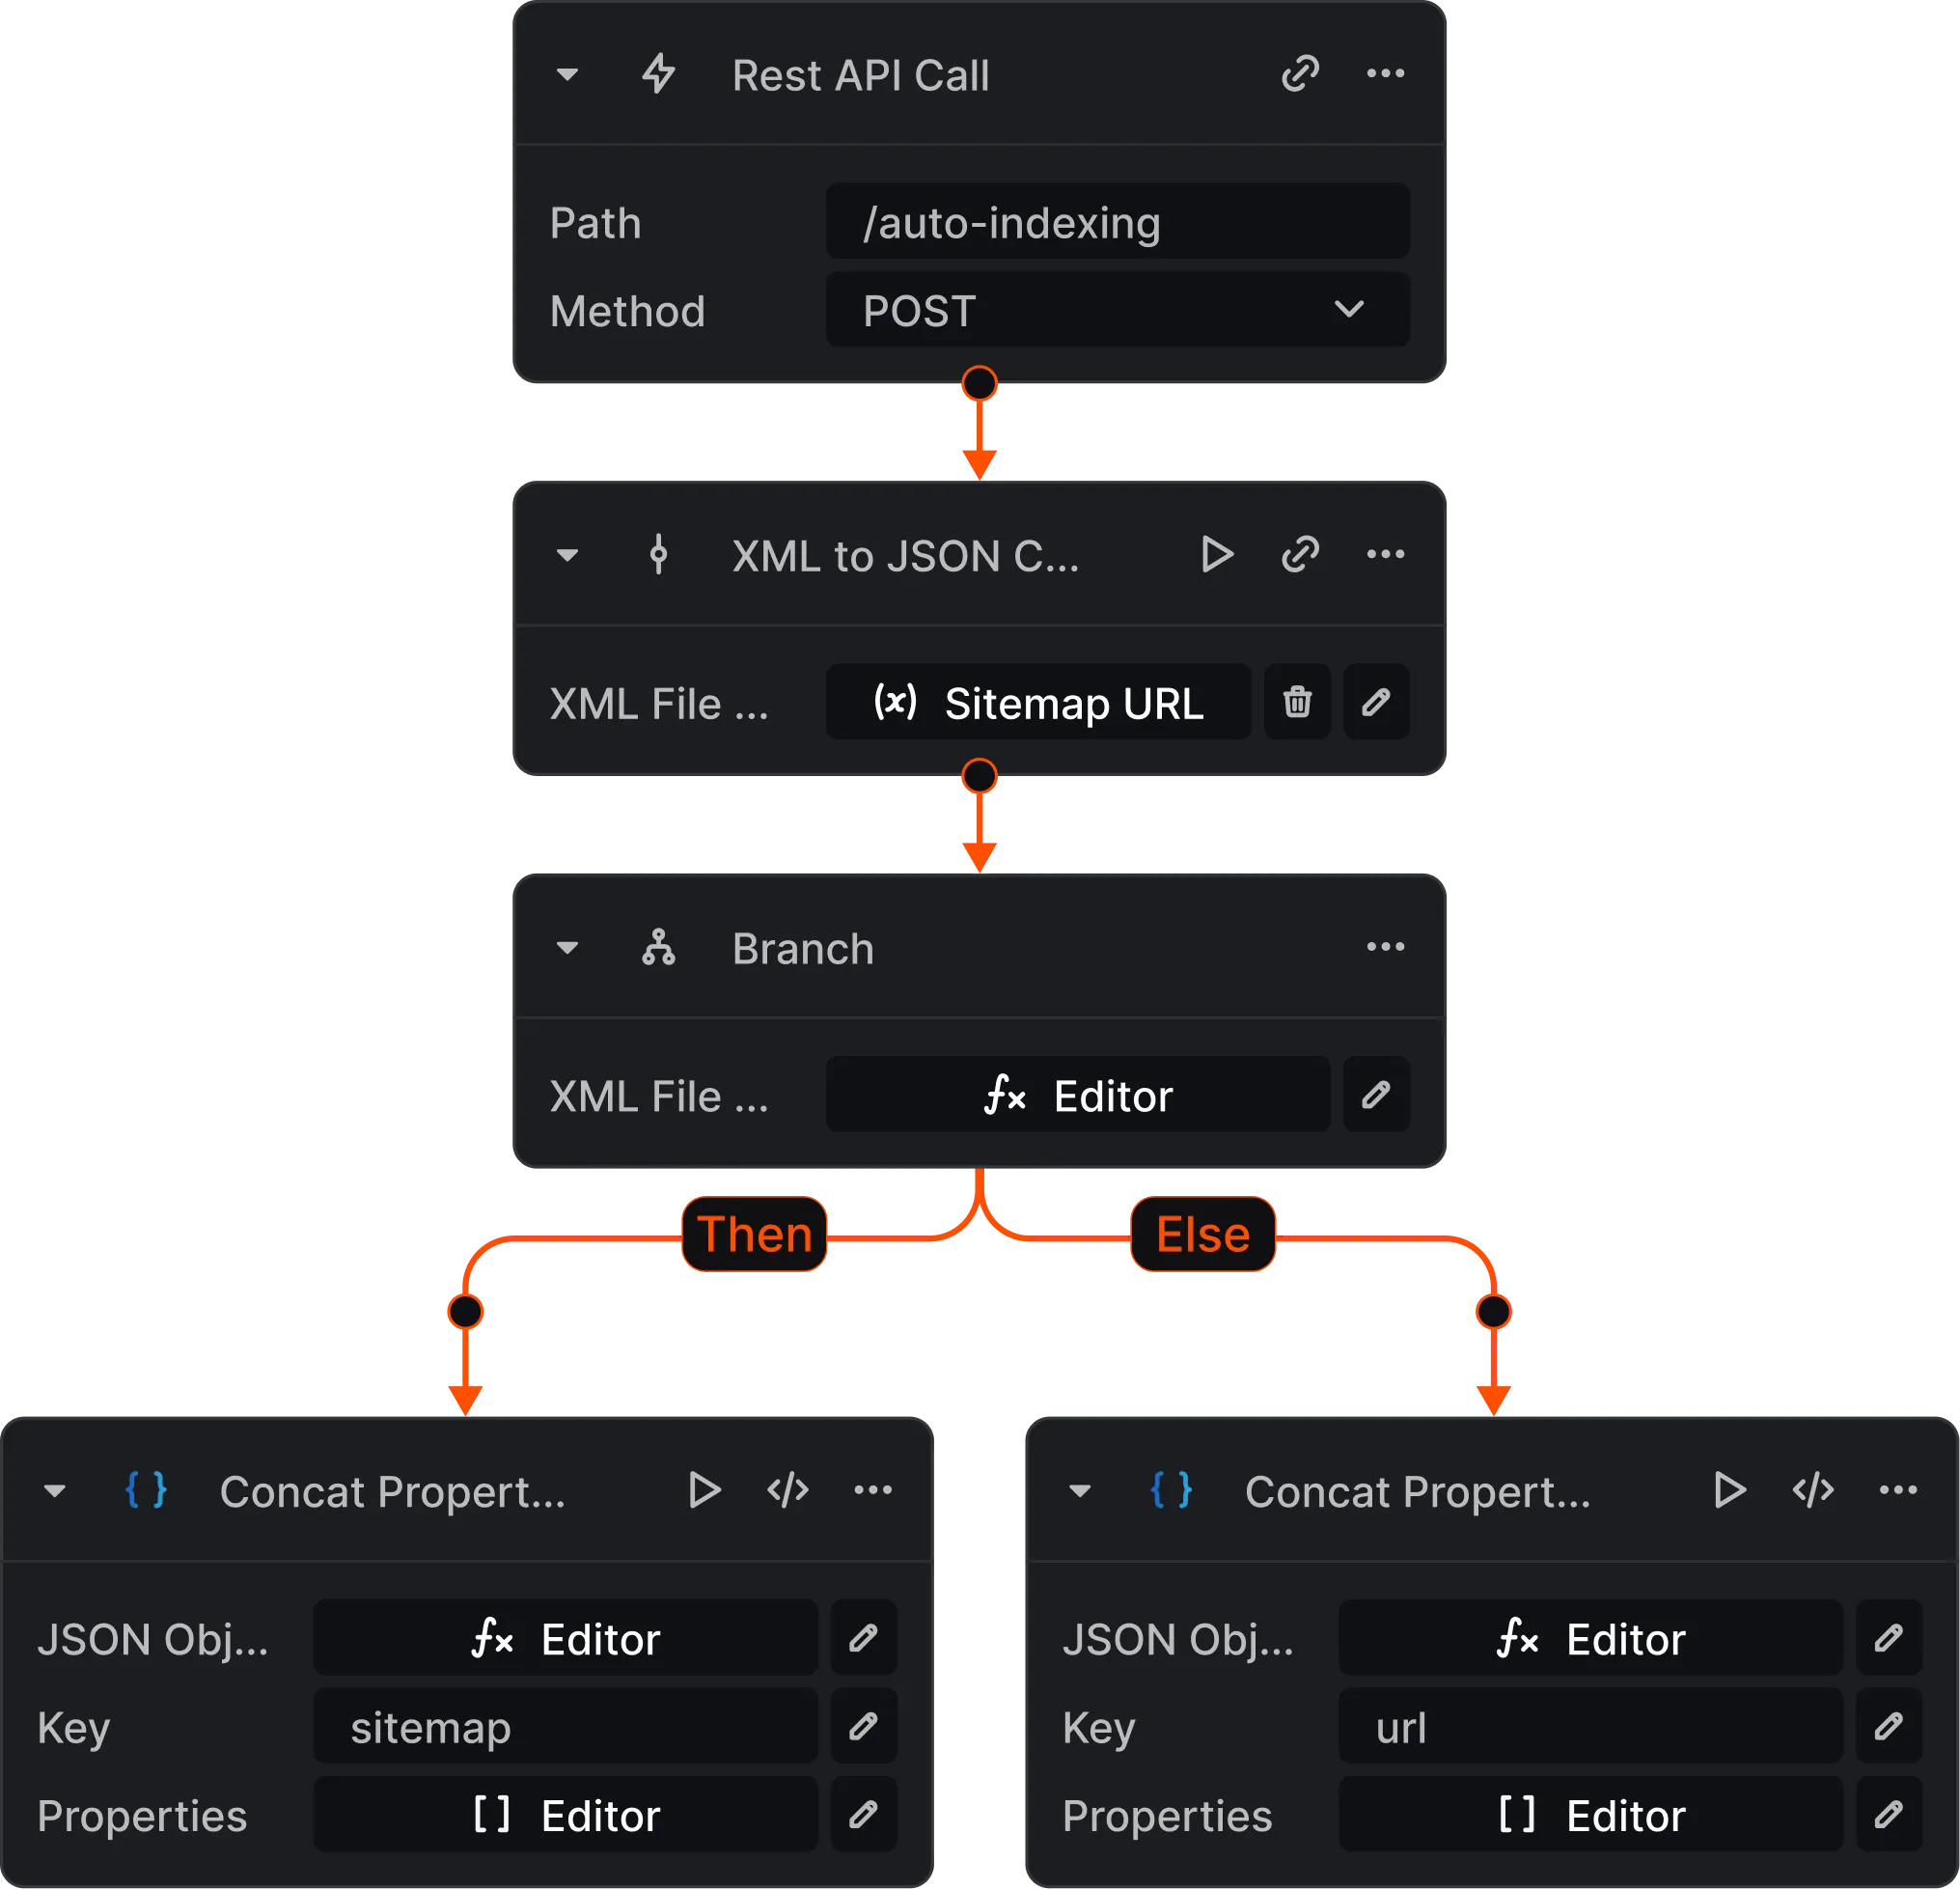
Streamlined marketing workflows and real-time analytics for better decision-making.

Streamlined marketing workflows and real-time analytics for better decision-making.
Streamlined marketing workflows and real-time analytics for better decision-making.
Streamlined marketing workflows and real-time analytics for better decision-making.
Streamlined marketing workflows and real-time analytics for better decision-making.
Streamlined marketing workflows and real-time analytics for better decision-making.
Streamlined marketing workflows and real-time analytics for better decision-making.
Streamlined marketing workflows and real-time analytics for better decision-making.
Streamlined marketing workflows and real-time analytics for better decision-making.
Streamlined marketing workflows and real-time analytics for better decision-making.
Streamlined marketing workflows and real-time analytics for better decision-making.
Streamlined marketing workflows and real-time analytics for better decision-making.
Streamlined marketing workflows and real-time analytics for better decision-making.
Streamlined marketing workflows and real-time analytics for better decision-making.
Streamlined marketing workflows and real-time analytics for better decision-making.
Streamlined marketing workflows and real-time analytics for better decision-making.
Streamlined marketing workflows and real-time analytics for better decision-making.
Streamlined marketing workflows and real-time analytics for better decision-making.
Want Your Project Featured?
Share your success story and inspire other teams.

.webp)
Real results with software coaching
Unlock measurable growth with powerful automation tools and expert coaching—designed to drive results faster.
Before using this platform, our team wasted so much time on repetitive manual tasks. Now, everything is automated — from reporting to task assignments. The best part is the live dashboards, which give us real- time visibility into performance.

Before using this platform, our team wasted so much time on repetitive manual tasks. Now, everything is automated — from reporting to task assignments. The best part is the live dashboards, which give us real- time visibility into performance.
Before using this platform, our team wasted so much time on repetitive manual tasks. Now, everything is automated — from reporting to task assignments. The best part is the live dashboards, which give us real- time visibility into performance.
Before using this platform, our team wasted so much time on repetitive manual tasks. Now, everything is automated — from reporting to task assignments. The best part is the live dashboards, which give us real- time visibility into performance.
Before using this platform, our team wasted so much time on repetitive manual tasks. Now, everything is automated — from reporting to task assignments. The best part is the live dashboards, which give us real- time visibility into performance.
Before using this platform, our team wasted so much time on repetitive manual tasks. Now, everything is automated — from reporting to task assignments. The best part is the live dashboards, which give us real- time visibility into performance.
.webp)